Why Lithium Battery Cycle Life Claims Mislead B2B Buyers
A distributor in Southeast Asia purchased 200 units of LiFePO4 energy storage batteries rated for 6,000 cycles. Eighteen months later, field tests showed capacity had already dropped to 84% — after only 500 equivalent cycles. The manufacturer’s response: “The 6,000-cycle rating was tested at 25°C, 0.5C, and 80% DoD. Your installation environment doesn’t match test conditions.”
This is not an isolated incident. Across DIY Solar Forum, Reddit, and industry procurement channels, the gap between advertised lithium battery cycle life and real-world performance is the single most discussed pain point among B2B buyers. An industry insider on a Chinese energy storage forum stated bluntly: “Take 60–70% of the rated 6,000 cycles as your realistic expectation.” NZ Lithium, a battery review platform, goes further: “If cycle life claims come without detailed test conditions, divide the number by four.”
For distributors, installers, and OEM procurement teams, this gap destroys project ROI calculations. A battery bank sized for a 10-year warranty period may need replacement at year six. End customers lose trust. Warranty claims pile up. And the procurement team is left explaining why the spec sheet promised one thing and the field delivered another.
Understanding what truly determines LiFePO4 battery lifespan — beyond the marketing number — is the first step toward making procurement decisions that hold up in the real world.
What Determines LiFePO4 Battery Lifespan in Real-World Conditions
The Olivine Crystal Structure Advantage
LiFePO4 (lithium iron phosphate) batteries outlast other lithium chemistries because of their cathode’s olivine crystal structure. The strong phosphorus-oxygen bonds in this structure resist breakdown during charge and discharge cycles. Unlike NMC (nickel manganese cobalt) or LCO (lithium cobalt oxide) cathodes, which undergo significant structural expansion and contraction during cycling, the LFP olivine framework maintains its integrity over thousands of cycles.
This molecular stability means the SEI (solid electrolyte interphase) layer on the anode grows more slowly, internal resistance increases more gradually, and the cathode material resists the micro-cracking that plagues other chemistries. The result: a fundamentally longer lasting battery chemistry.
But chemistry alone doesn’t guarantee a long cycle life battery. The same LFP cells can deliver 6,000 cycles in a controlled laboratory and 2,500 cycles in a poorly designed system. The difference comes down to how the battery is managed.
Cycle Aging vs Calendar Aging — Two Clocks Running Simultaneously
Most buyers focus exclusively on cycle count. But LiFePO4 battery lifespan is governed by two independent degradation mechanisms:
Cycle aging — the physical and chemical wear that occurs during each charge-discharge cycle. Every cycle causes microscopic mechanical stress as lithium ions move in and out of the crystal lattice. Over time, this stress accumulates as capacity loss.
Calendar aging — degradation that occurs over time regardless of usage. Electrolyte side reactions continue even when the battery sits idle. Temperature and state of charge during storage are the dominant factors.
A real-world case from a Chinese energy storage project illustrates this perfectly. A battery system installed in 2022, placed in an outdoor cabinet without shade, with air conditioning that frequently failed — after three years, only 800 cycles had been completed (a fraction of the rated 6,000), yet State of Health (SOH) had already dropped to 83%. Calendar aging, accelerated by heat, killed the battery before cycling did.
For B2B buyers, this means backup and standby systems — which cycle infrequently but sit at high SOC for months — may fail from calendar aging while cycle counts look healthy. Procurement specifications that only address cycle life are incomplete.
The 6 Hidden Factors That Destroy Long Cycle Life Battery Performance
Depth of Discharge — The Multiplicative Effect
Depth of Discharge (DoD) has a non-linear, multiplicative impact on lithium battery cycle life. The relationship is not incremental — it is exponential.
Research from the National Renewable Energy Laboratory (NREL) demonstrates that restricting DoD to 70% can extend lifespan by 150% compared to full discharges. A French battery data source shows an LFP cell delivering approximately 3,221 cycles at 80% DoD, but nearly 34,957 cycles at 20% DoD.
| DoD Level | Typical Cycle Life | Equivalent Years (1 cycle/day) | Capacity Retention After 3 Years |
|---|---|---|---|
| 100% | 1,500–3,000 | 4–8 years | 75% |
| 80% | 3,500–6,000 | 9–16 years | 82% |
| 50% | 6,000–10,000 | 16–27 years | 88% |
| 20% | 20,000+ | 54+ years | 95% |
The practical implication for system design: oversizing a battery bank by 20% — reducing daily DoD from 80% to roughly 60% — can extend total lifespan by 50–100%. This is the single highest-leverage design decision for maximizing LiFePO4 battery lifespan.
Temperature — The Silent Accelerant
Temperature is the most underestimated lifespan factor because its effects accumulate gradually and invisibly.
| Operating Temperature | Cycle Life Impact | Real-World Scenario |
|---|---|---|
| 15–25°C | Baseline (optimal) | Climate-controlled indoor installation |
| 35°C | 15–25% reduction | Poorly ventilated cabinet |
| 40°C | 20–30% reduction | Outdoor enclosure without active cooling |
| 45°C+ | Life cut nearly in half | Desert climate, no thermal management |
| Below 0°C (charging) | Permanent lithium plating damage | Cold climate without low-temp charge protection |
A field case documented on a Chinese industry forum: a facility operator turned off the cooling fan to save electricity. Within two years, the battery system showed significantly faster degradation than identical systems in the same area that kept cooling active. The cost saving from the fan was trivial compared to the accelerated capacity loss.
For projects in hot climates — the Middle East, Southeast Asia, Africa, the southern United States — active thermal management is not optional. Without it, advertised lithium battery cycle life is unachievable regardless of cell quality.
BMS Quality — The Brain That Determines Real Lifespan
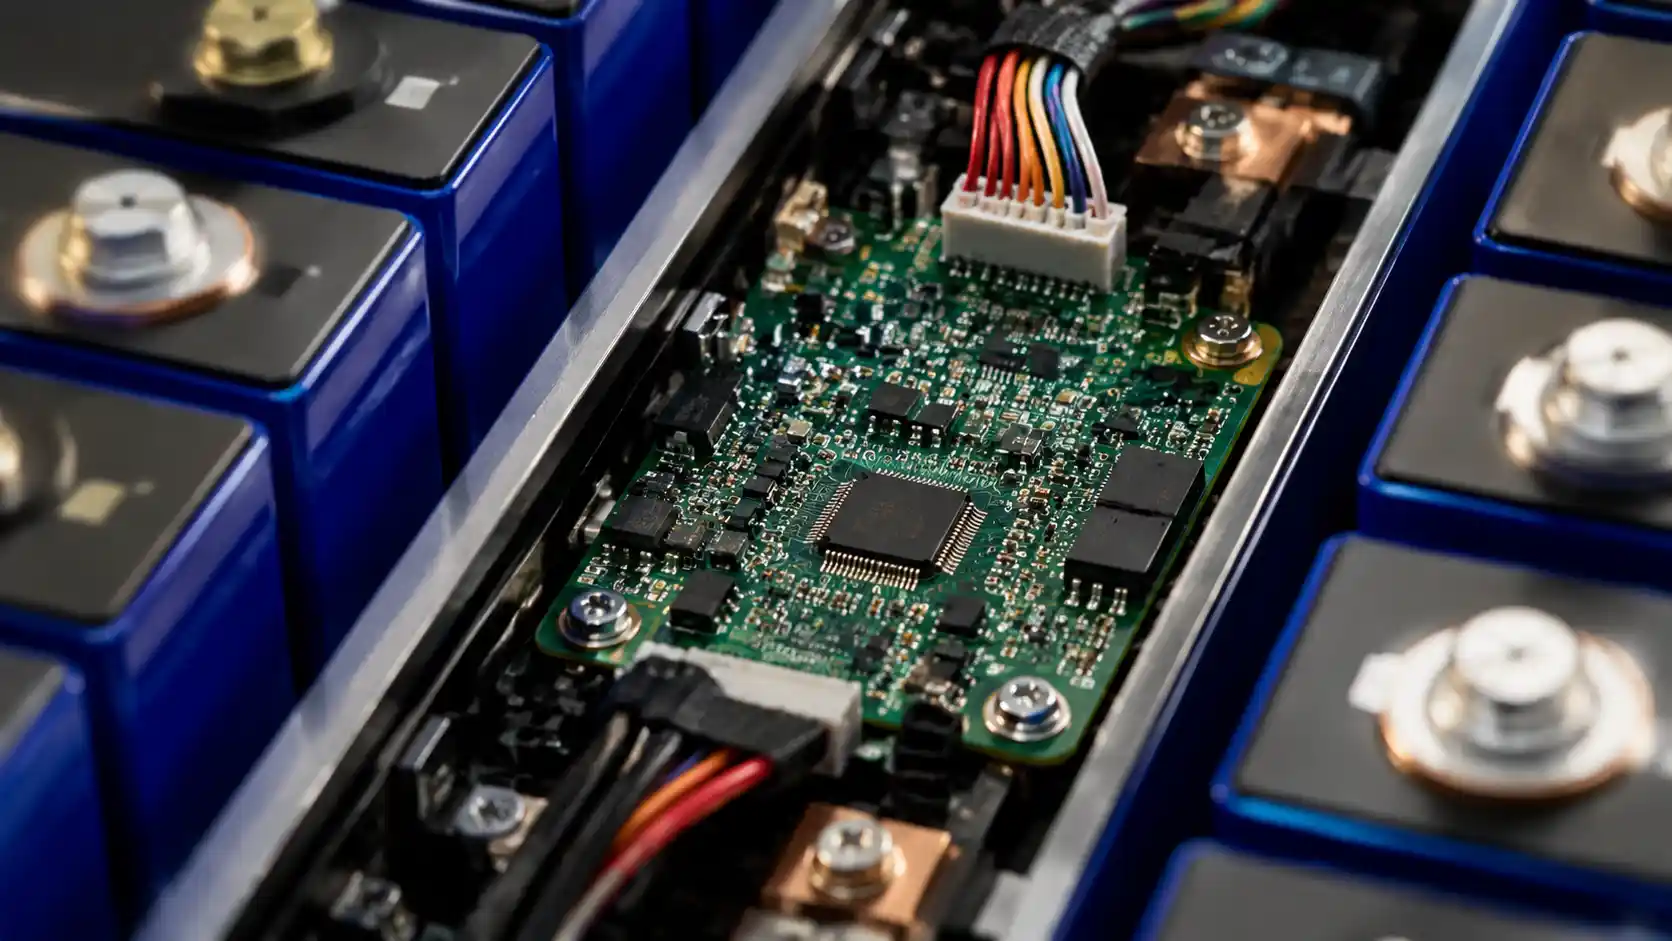
The Battery Management System is the single most predictive component for field failure rate. A battery pack with Grade A cells and a cheap BMS will fail before a pack with Grade B cells and a quality BMS.
Real evidence from DIY Solar Forum: A user reported that their battery’s BMS failed to shut off when one cell dropped below 2.5V. They woke up to find a cell at 1.7V while the battery was still outputting power. The BMS only disconnected at total pack voltage below 10.5V — far too late to protect individual cells. The manufacturer had also retroactively changed the warranty from 6 years to 3 years.
In another documented case, a buyer invested $4,800 in six 100Ah LiFePO4 batteries from a well-known brand. Within 3–4 years, four of six units failed — one dropped to 8–9V under load, another to 4–5V, a third wouldn’t wake from low-voltage cutoff, and a fourth was completely dead at 0V. Static voltage on all units appeared normal (13.47–14.01V), proving that terminal voltage alone is not a reliable health indicator.
A Hackaday teardown of a failed battery revealed the root cause: one cell had internal resistance of 3+ Ohms while others measured in milli-Ohms. A single degraded cell dragged down the entire pack. The Bluetooth BMS had also died, removing any monitoring capability.
Quality BMS features that protect long cycle life battery performance include:
- Cell-level voltage monitoring (not just pack-level)
- Active cell balancing (not passive only)
- Low-temperature charge cutoff (below 0°C)
- Over-current and short-circuit protection with fast response time
- Real-time SOC and SOH reporting via CAN/RS485 communication
High SOC Storage — Calendar Aging’s Best Friend
Keeping LiFePO4 batteries at 100% state of charge for extended periods dramatically accelerates calendar aging. This is particularly relevant for backup and UPS applications where batteries sit at float voltage indefinitely.
A DIY Solar Forum user documented this effect precisely: CATL 304Ah cells, initially rated at 310Ah, were kept on shore power at 13.9V float for two years. After only 31 cycles, capacity had dropped to 285Ah — an 8% loss from calendar aging alone, with virtually no cycling contribution.
| Storage Condition | Calendar Aging Rate | Recommended For |
|---|---|---|
| 100% SOC, hot environment | Fastest degradation | Avoid for standby |
| 100% SOC, cool environment | Moderate degradation | Short-term only |
| 50–60% SOC, cool environment | Slowest degradation | Long-term storage |
| 0% SOC (empty) | Risk of over-discharge damage | Never recommended |
For B2B system designers, this means backup applications need SOC management protocols. Set BMS float voltage limits to maintain SOC at 50–70% during standby, with periodic full charge cycles to maintain cell balance.
C-Rate Stress — Fast Charging Has a Price
C-rate refers to the speed of charging or discharging relative to battery capacity. Higher C-rates generate more internal heat and mechanical stress, reducing cycle life.
Cells cycled at 2C reach 60% SOH within approximately 500–600 cycles. The same cells cycled at 0.5C deliver approximately 2,000+ cycles. High-rate cycling shifts the aging mechanism from surface-related degradation to structural damage — particle cracking and loss of active material contact that cannot be reversed.
For energy storage applications, standard charge and discharge at 0.5C is the sweet spot. Reserve higher C-rates for grid frequency response or peak shaving events that last seconds, not hours.
Cell Inconsistency — The Weakest Cell Problem
A battery pack is only as strong as its weakest cell. Manufacturing variations create initial differences in capacity and internal resistance. Over hundreds of cycles, these differences amplify. Without active cell balancing, the weakest cell determines total pack capacity.
Lab tests typically measure individual cells or small modules. Real-world systems contain dozens or hundreds of cells in series-parallel configurations. The gap between single-cell test results and pack-level performance is one of the most underappreciated sources of cycle life disappointment.
Quality manufacturers address this through:
- Incoming cell inspection and capacity sorting (±1% tolerance)
- Internal resistance (IR) matching before assembly
- Active cell balancing BMS that compensates for drift over time
- Annual capacity audits to identify degrading cells before they affect pack performance
How to Decode Cycle Life Spec Sheets (Marketing vs Reality)
No mandatory industry standard governs how manufacturers test and report lithium battery cycle life. The same “6,000 cycles” claim can represent wildly different real-world outcomes depending on test conditions.
| Test Parameter | “Favorable” (Inflates Cycles) | “Realistic” (Conservative) | Impact |
|---|---|---|---|
| DoD | 50% | 80–90% | 50% DoD can show 2–3× more cycles |
| Temperature | 25°C (controlled lab) | 35–45°C (field conditions) | Every 10°C above 25°C reduces life 15–25% |
| C-rate | 0.2C (very gentle) | 0.5–1C (real use) | Lower C-rate = less stress = more cycles |
| EOL threshold | 70% (loose) | 80% (strict) | 70% EOL gives 10–15% more “cycles” |
| Test sample | Best individual cell | Full pack with BMS | Pack-level results are always lower |
Four questions every B2B buyer must ask before accepting any cycle life claim:
- What DoD was used in the cycle life test?
- What temperature was the test run at?
- What C-rate was used for charge and discharge?
- Is the cycle count measured to 80% SOH or 70% EOL?
A supplier who cannot answer these questions — or hesitates on any of them — is a supplier whose cycle life numbers should be treated with skepticism. Transparency about test conditions is the strongest quality signal.
Understanding the Warranty Trap in LiFePO4 Battery Lifespan
Battery warranties are legal documents designed to limit manufacturer liability, not guarantee performance. Understanding their structure is essential for B2B buyers who rely on warranty coverage to protect end-customer relationships.
Most LiFePO4 battery warranties follow this structure: “10 years OR 6,000 cycles OR X MWh throughput — whichever comes first.” The “whichever comes first” clause is the trap. Heavy users hit the throughput limit years before the time limit. A system cycling twice daily will exhaust 6,000 cycles in 8 years, not 10.
Common warranty voids that buyers overlook:
- Installation by non-certified personnel
- Use with unauthorized inverter brands
- Operating temperature outside specified range (often 15–35°C)
- DoD beyond manufacturer specification
- No maintenance or monitoring records
- Charging below 0°C without low-temperature protection
- Modification or repair by unauthorized personnel
One documented case: a buyer’s 6-year warranty was retroactively reduced to 3 years when the manufacturer updated their website. The buyer had no recourse because the original warranty terms were not preserved in writing.
Another case: warranty was approved but the RMA process — shipping, testing, replacement — was so costly and time-consuming that the buyer abandoned the claim entirely. The effective warranty value was zero.
For B2B procurement, the warranty analysis checklist should include:
| Warranty Element | What to Verify | Red Flag |
|---|---|---|
| Coverage period | Years AND cycles AND throughput | “10 years” with no cycle/throughput limit |
| Capacity guarantee | Minimum SOH at end of warranty | No capacity guarantee stated |
| Void conditions | List of exclusions | Vague “improper use” clauses |
| RMA process | Who pays shipping, timeline, replacement terms | Buyer pays all shipping and testing |
| Company longevity | Will the manufacturer exist in year 8? | New company, no track record |
| Transferability | Can warranty transfer to end customer? | Non-transferable |
Total Cost of Ownership: The Real Math Behind Long Cycle Life Battery Investment
Procurement teams often compare upfront cost per kWh. But the true cost of a battery system is measured over its entire service life. Here’s a TCO model based on real-world degradation rates:
| Factor | Budget Battery (Rated 6,000 cycles) | Quality Battery (Rated 6,000 cycles) |
|---|---|---|
| Upfront cost (100 kWh system) | $25,000 | $35,000 |
| Real-world cycle achievement (60% of rated) | 3,600 cycles | 5,400 cycles (90% of rated) |
| Years of service (1 cycle/day) | 9.9 years | 14.8 years |
| Replacement cost over 15 years | $25,000 (1 full replacement) | $0 |
| Installation labor per replacement | $3,000 | $0 |
| Downtime cost per replacement event | $5,000 | $0 |
| Warranty claim processing (avg) | $2,000 | $0 |
| 15-Year TCO | $60,000 | $35,000 |
| Cost per kWh delivered (15 years) | $1.67/kWh | $0.97/kWh |
The “cheaper” battery costs 72% more over its service life. This is the calculation that procurement teams need to present to decision-makers who focus on upfront cost.
10-Point Supplier Evaluation Checklist for Lithium Battery Cycle Life Verification
| # | Evaluation Point | Green Flag | Red Flag |
|---|---|---|---|
| 1 | Cycle life test report | Provides full report with DoD, temp, C-rate, EOL | Only provides a number, no test conditions |
| 2 | Test sample type | Pack-level test with BMS | Single cell test only |
| 3 | Third-party verification | Independent lab report (IEC 62660, GB/T 31484) | Self-reported data only |
| 4 | BMS specifications | Active balancing, cell-level monitoring, <1ms response | Passive balancing, pack-level only |
| 5 | Cell sourcing | Grade A cells from Tier 1 manufacturers (CATL, EVE, REPT) | Unbranded or untraceable cells |
| 6 | Cell matching | Capacity tolerance ±1%, IR matching before assembly | No sorting data, mixed batches |
| 7 | Thermal management | Active cooling design, thermal sensors per cell | No thermal management, passive only |
| 8 | Calendar aging data | Provides storage degradation curves at multiple temps/SOC | No calendar aging data available |
| 9 | Warranty structure | Clear capacity guarantee, reasonable voids, RMA process documented | “10 years” with no specifics |
| 10 | Manufacturing quality | ISO 9001, IATF 16949, traceability system, batch tracking | No quality certifications, no traceability |
How Voltcrave Power Ensures Verified Lithium Battery Cycle Life
Voltcrave Power approaches lithium battery cycle life verification differently from typical suppliers. Rather than publishing a single marketing number, the company backs its cycle life claims with transparent testing infrastructure and B2B-grade quality systems.
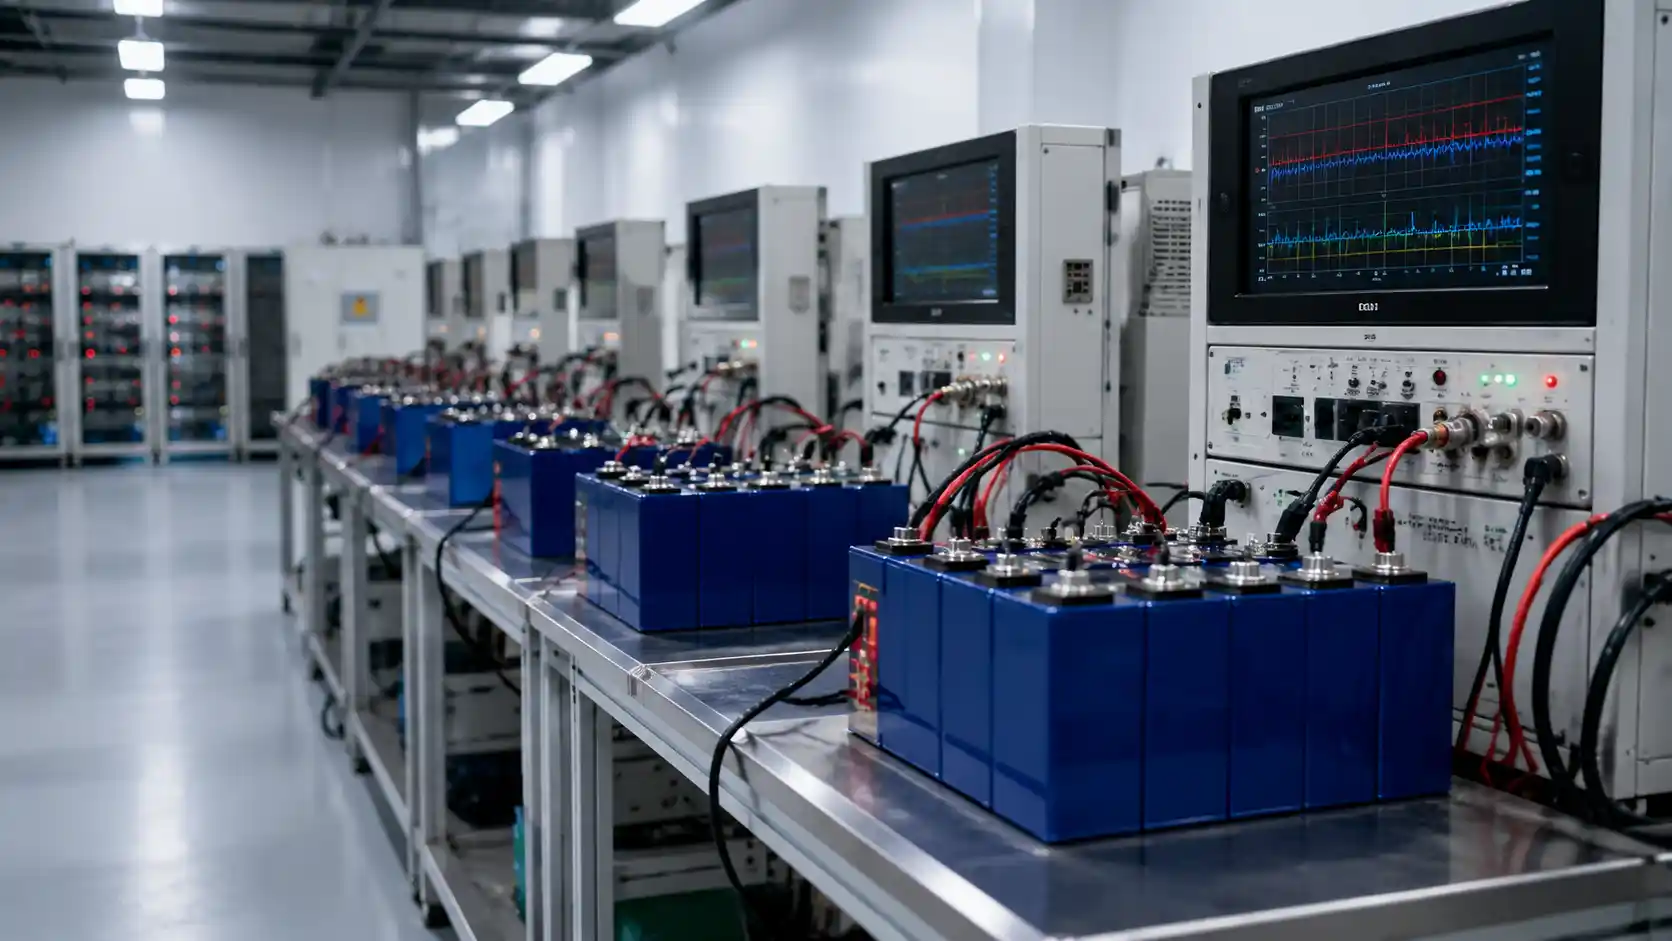
Testing Infrastructure: Voltcrave Power operates an integrated battery testing platform with 200+ test items and 20,000+ test channels, achieving 100% process coverage from raw materials to finished cells. This means every cell is tested — not just a sample batch — and the data is traceable to the specific production line and date.
BMS Engineering: The automotive-grade 8-layer BMS used in Voltcrave Power systems provides cell-level voltage monitoring, active cell balancing, and fault response in under 100 microseconds. This is the BMS quality level that the market research shows is the #1 predictor of achieving rated cycle life in the field.
Cell Quality Control: Voltcrave Power implements incoming cell inspection with capacity sorting and internal resistance matching before assembly. This addresses the weakest-cell problem that destroys pack-level performance in cheaper systems.
Standards Leadership: With participation in drafting 19 national standards, 14 industry standards, and 35 group standards (68 total), Voltcrave Power contributes to the regulatory frameworks that define battery testing and quality benchmarks — giving buyers confidence that the company understands cycle life from both the manufacturing and standards perspective.
Thermal Management: Voltcrave Power systems undergo thermal management testing across -40°C to +85°C operating ranges, ensuring that cycle life claims account for real-world temperature exposure rather than ideal laboratory conditions alone.
Manufacturing Scale: With 32+ production lines, 50MW+ monthly production capacity, 120+ engineers, and 15+ years of experience serving 30+ countries, Voltcrave Power has the manufacturing maturity and financial stability to honor long-term warranty commitments — the factor that the market research identifies as critical for warranty value.
Procurement Flexibility: Voltcrave Power offers stock products starting at 10–20 unit MOQ for distributors who need to validate performance before committing to volume, and OEM/branded customization starting at 300–500 unit MOQ for project developers and brand owners who need tailored specifications.
FAQs
What is the real-world lithium battery cycle life for LiFePO4 cells?
Real-world lithium battery cycle life for LiFePO4 cells typically reaches 60–70% of advertised numbers under normal operating conditions. A battery rated for 6,000 cycles at 25°C, 0.5C, and 80% DoD may deliver 3,600–4,200 cycles in field conditions with temperature swings, irregular loads, and system-level losses. Buyers should request full test condition documentation and apply a 60–70% derating factor when calculating project ROI.
How does calendar aging affect LiFePO4 battery lifespan?
Calendar aging degrades LiFePO4 battery lifespan regardless of cycling. It is driven by electrolyte side reactions that continue continuously, accelerated by high temperature and high state of charge. A battery stored at 45°C and 100% SOC may lose significant capacity within 2–3 years even with minimal cycling. For backup and standby applications, maintain SOC at 50–70% during idle periods and ensure temperature stays within 15–25°C to minimize calendar aging.
What DoD should I design for to maximize long cycle life battery performance?
For maximum long cycle life battery performance, design systems to operate at 50–70% DoD for daily cycling. NREL research shows that restricting DoD to 70% extends lifespan by 150% compared to 100% discharge. At 50% DoD, LiFePO4 cells can achieve 6,000–10,000+ cycles. Oversizing the battery bank by 20% to reduce daily DoD is the single highest-return design decision for extending service life.
Can I charge LiFePO4 batteries below 0°C?
No. Charging LiFePO4 batteries below 0°C causes lithium plating on the anode — permanent, irreversible damage that reduces capacity by 1–5% per incident. Quality BMS units include low-temperature charge protection that blocks charging until cell temperature rises above 0°C. For cold-climate installations, specify batteries with built-in self-heating that warms cells to safe charging temperature before accepting current. Discharging below 0°C is safe but temporarily reduces available capacity.
How do I verify a supplier’s cycle life claims before bulk purchase?
Request four documents: (1) full cycle life test report specifying DoD, temperature, C-rate, and EOL threshold; (2) third-party verification from an accredited lab (IEC 62660, GB/T 31484); (3) pack-level test data (not single-cell only); (4) calendar aging data at multiple temperatures and SOC levels. Additionally, purchase sample units for independent testing before committing to volume orders. Stock products from Voltcrave Power are available at 10–20 unit MOQ for exactly this validation purpose.
What BMS features are critical for achieving rated LiFePO4 battery lifespan?
Critical BMS features include: cell-level voltage monitoring (not just pack-level), active cell balancing (not passive only), low-temperature charge cutoff below 0°C, over-current protection with sub-millisecond response time, and real-time SOC/SOH reporting via CAN or RS485 communication. A quality BMS is the #1 predictor of field failure rate — a battery with Grade A cells and a cheap BMS will fail before a battery with Grade B cells and a quality BMS.
How does temperature impact lithium battery cycle life in hot climates?
Every 10°C above 25°C reduces lithium battery cycle life by 15–25%. At 40°C, expect 20–30% fewer cycles than rated. At 45°C and above, cycle life is cut nearly in half. Projects in the Middle East, Southeast Asia, Africa, and the southern United States require active thermal management — passive cooling is insufficient. Specify thermal management testing data across the full operating range when evaluating suppliers for hot-climate deployments.
What warranty structure should I look for when procuring long cycle life battery systems?
Look for warranties that specify: (1) coverage period in years, cycles, AND throughput — understand which limit applies first; (2) minimum SOH guarantee at end of warranty (typically 60–70%); (3) clear list of void conditions; (4) RMA process with defined timelines and cost responsibility; (5) manufacturer financial stability to honor long-term commitments. Avoid warranties that state “10 years” without specifying cycle/throughput limits or capacity guarantees.
What is the difference between 80% SOH and 70% EOL in cycle life testing?
80% SOH (State of Health) means the battery retains 80% of its original capacity — the stricter, more conservative end-of-life threshold. 70% EOL (End of Life) allows the battery to degrade further before counting “cycles,” yielding 10–15% more cycles on paper. A supplier using 70% EOL will always show a higher cycle count than one using 80% SOH for the same cell. Always verify which threshold is used before comparing cycle life numbers across suppliers.
What MOQ should I expect for OEM customized LiFePO4 battery systems?
For OEM-branded and customized LiFePO4 battery systems, MOQ typically starts at 300–500 units. Stock products without customization are available at lower MOQs of 10–20 units for sampling and validation. Voltcrave Power offers stock products at 10–20 unit MOQ and OEM/customized products at 300–500 unit MOQ, allowing buyers to validate real-world performance before committing to volume procurement.
Ready to Source Batteries That Actually Deliver Their Rated Cycle Life?
Stop guessing about lithium battery cycle life. Stop accepting spec sheet numbers without test condition documentation. Stop losing margin on premature battery replacements.
Voltcrave Power provides:
- Full cycle life test reports with documented DoD, temperature, C-rate, and EOL threshold
- Automotive-grade 8-layer BMS with sub-100µs fault response
- 200+ test items, 20,000+ test channels, 100% process coverage
- Stock products at 10–20 unit MOQ for performance validation
- OEM customization at 300–500 unit MOQ for project-scale deployment
- 15+ years of manufacturing experience, 30+ countries served
Contact Voltcrave Power today to request sample units, full test documentation, and a TCO analysis for your next energy storage project. Your end customers deserve batteries that last as long as the spec sheet promises.
Need help matching this topic to a real battery project?
Send your target application, capacity range, certification market, and order plan. VoltCrave can recommend a practical product direction.