
Quick Answer: How Is Peak Shaving Battery Storage ROI Calculated?
Peak shaving battery storage ROI is calculated by comparing the total financial benefit of reducing peak demand against the full cost of owning and operating the battery energy storage system.
The simplest starting formula is:
Monthly demand charge savings = Avoided peak demand (kW) x Demand charge rate ($/kW)
Then:
Annual demand charge savings = Monthly demand charge savings x 12
And:
Simple payback period = Total installed system cost / Annual net savings
However, this simple formula is only a first estimate. A serious B2B buyer should also include:
- Battery usable capacity
- PCS power limit
- Round-trip efficiency
- Peak event duration
- Demand ratchet clauses
- Battery degradation
- Maintenance and auxiliary loads
- EMS performance
- Financing cost
- Replacement or augmentation cost
- Tariff changes
A battery that looks profitable in a spreadsheet may fail in real operation if the load profile is wrong, the EMS responds too slowly, or the system cannot sustain the required power for the full peak event.
Why Peak Shaving ROI Matters for Commercial Buyers
Commercial and industrial electricity bills often include demand charges based on the highest power demand recorded during a billing period. These charges are based on kW, not total energy consumption in kWh.
For many facilities, a few short peak events can create a large portion of the monthly bill. Peak shaving uses a battery energy storage system to discharge during those high-demand periods and reduce the measured peak.
Peak shaving may be attractive for:
- Factories with short production peaks
- Commercial buildings with HVAC-driven demand peaks
- Warehouses and cold storage facilities
- EV charging stations
- Solar-plus-storage commercial sites
- Industrial parks
- Hotels and hospitals
- Remote facilities with weak grid capacity
The U.S. Department of Energy’s BESS evaluation guidance identifies peak shaving as battery discharge used to reduce instantaneous peak demand. For buyers, the commercial question is whether the avoided peak charges are large enough to justify the system cost.
Step 1: Understand the Demand Charge Structure
Before sizing or purchasing a battery, identify how the utility calculates demand charges.
Basic demand charge
A utility may charge a customer based on the highest measured kW demand during the billing month.
Example:
Monthly peak demand: 800 kW
Demand charge rate: $18/kW
Monthly demand charge: 800 x 18 = $14,400
If a battery reduces the measured peak from 800 kW to 650 kW:
Avoided demand: 150 kW
Monthly savings: 150 x 18 = $2,700
Time-based demand charge
Some tariffs apply demand charges only during certain on-peak periods. This can improve ROI if the facility peaks predictably during those windows.
However, if the facility peak occurs outside the chargeable period, the battery may not create the expected savings.
Seasonal demand charge
Demand charges may be higher in summer or winter. Facilities with seasonal HVAC or production loads should model each season separately.
Demand ratchet
A demand ratchet can bill a customer based partly on a previous peak, even if the current month’s peak is lower. This can make one missed peak financially painful.
Buyers should ask:
- Is the demand charge based on monthly peak, annual peak, or seasonal peak?
- Is there a ratchet clause?
- What time interval is used to measure demand?
- Are there separate on-peak and off-peak demand charges?
- Does the tariff include power factor penalties?
- Can storage charging create a new peak?

Step 2: Analyze the Load Profile
Peak shaving ROI cannot be calculated accurately from a monthly bill alone. The project needs interval load data.
Useful load profile data includes:
- 15-minute, 30-minute, or hourly demand data
- Daily peak demand
- Peak duration
- Weekday and weekend patterns
- Seasonal variation
- Production schedule
- HVAC load behavior
- EV charging sessions, if applicable
- Solar production, if applicable
The most important question is:
How many kW must the battery reduce, and for how long?
A short 150 kW peak lasting 20 minutes requires a different battery design from a 150 kW peak lasting four hours.
Step 3: Estimate Avoided Demand Charges
Start with the practical demand reduction target.
Example:
- Existing monthly peak: 800 kW
- Target grid import limit: 650 kW
- Avoided demand: 150 kW
- Demand charge rate: $18/kW
Monthly savings = 150 kW x $18/kW = $2,700
Annual gross savings = $2,700 x 12 = $32,400
If the facility only experiences this peak during six high-demand months:
Annual gross savings = $2,700 x 6 = $16,200
This is why seasonal analysis matters. A battery may look attractive if the same savings are assumed every month, but the real bill may not support that assumption.
Step 4: Calculate the Required Battery Power and Energy
Peak shaving battery sizing starts with kW and duration.
Required battery power = Facility peak demand - Target demand
Using the example:
800 kW - 650 kW = 150 kW
If the peak lasts for two hours:
Delivered energy required = 150 kW x 2 hours = 300 kWh
Then adjust for usable SOC and efficiency:
Required rated energy = Delivered energy / (Usable SOC fraction x discharge efficiency)
Assume:
- Usable SOC window: 80%
- Discharge efficiency: 95%
300 kWh / (0.80 x 0.95) = approximately 395 kWh
A practical starting point may be a system around 150 kW / 400 kWh, but a final design should be confirmed with load simulation.
For a full sizing method, see the Commercial BESS Sizing Guide.
Step 5: Estimate Total Installed Cost
Peak shaving ROI should use total installed cost, not only battery cabinet price.
Commercial BESS cost may include:
- Battery cells, modules, racks, or containers
- PCS
- EMS
- BMS
- Thermal management
- Fire detection and protection
- Switchgear and protection equipment
- Transformer
- Cables and connectors
- Enclosure or container
- Civil works
- Installation labor
- Engineering design
- Permitting
- Commissioning
- Monitoring platform
- Shipping
- Taxes and duties
- Spare parts
- Maintenance
If a quote includes only battery hardware, the ROI estimate will be incomplete. B2B buyers should request a clear scope of supply and a list of excluded items.
Step 6: Calculate Simple Payback
Assume:
- Total installed system cost: $180,000
- Annual gross demand charge savings: $32,400
- Annual O&M and monitoring cost: $3,000
Annual net savings = $32,400 - $3,000 = $29,400
Simple payback = $180,000 / $29,400 = 6.1 years
Simple payback is easy to understand, but it does not include financing, tax treatment, residual value, degradation, tariff changes, or opportunity cost. It should be used as a screening tool, not the only investment metric.
Step 7: Include Battery Degradation and Warranty
Battery capacity declines over time. If the ROI model assumes the same peak shaving capability every year, it may overstate value.
Ask the supplier:
- What is the guaranteed usable capacity at beginning of life?
- What is the guaranteed capacity at end of warranty?
- What annual cycle count is allowed?
- What depth of discharge is assumed?
- What temperature conditions apply?
- What throughput limits apply?
- Is augmentation required to maintain performance?
Example:
If the project requires 300 kWh delivered energy during peak events, but usable capacity falls below that requirement in year seven, the system may no longer deliver full savings unless the original design includes extra capacity or an augmentation plan.
Step 8: Account for Efficiency and Charging Cost
A battery consumes more energy during charging than it delivers during discharging because of round-trip losses.
If the system has 90% AC-to-AC round-trip efficiency, delivering 300 kWh may require approximately:
300 kWh / 0.90 = 333 kWh charged energy
The extra 33 kWh is an energy cost. In many peak shaving projects, demand charge savings are more important than energy arbitrage, but energy losses still affect net savings.
If the battery charges during expensive hours or accidentally creates a new peak, ROI can fall quickly. The EMS must schedule charging carefully.
Step 9: Test the EMS Dispatch Strategy
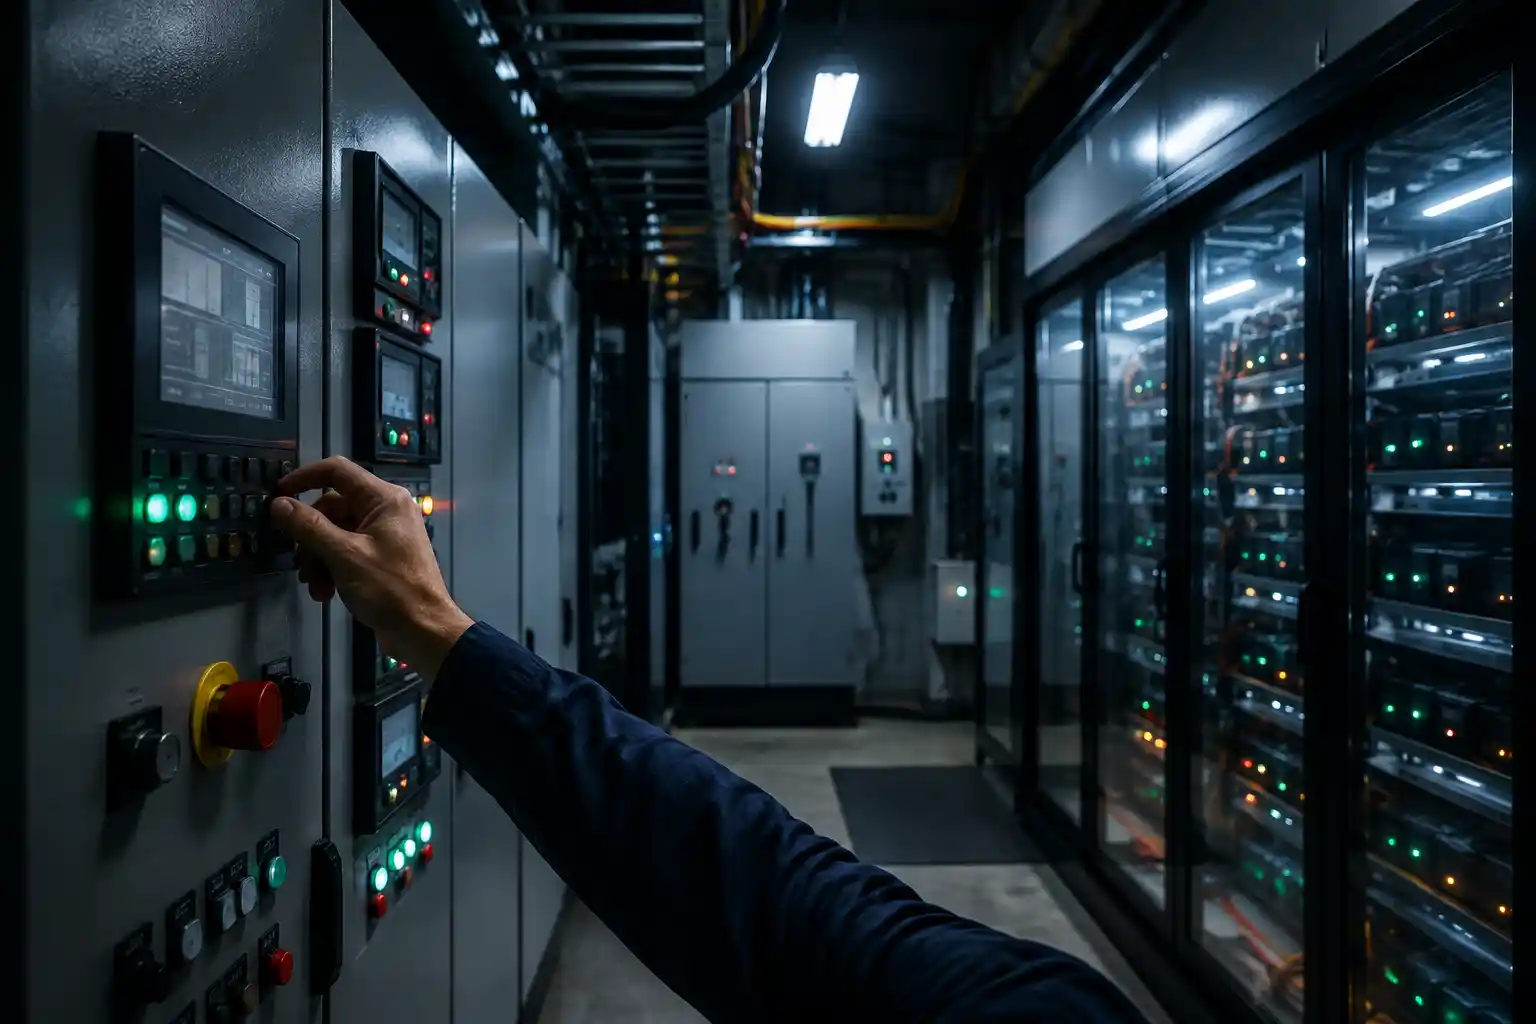
Peak shaving is not only a hardware problem. It is a control problem.
The EMS must:
- Monitor facility demand
- Predict whether a peak is forming
- Dispatch the battery before the billing interval closes
- Avoid unnecessary discharge
- Maintain SOC reserve
- Avoid charging during peak periods
- Respond to battery and PCS limits
- Record events for verification
The U.S. Department of Energy’s BESS evaluation method notes that peak-shaving applications can modulate charging and discharging rapidly. This is why fine interval data and responsive controls matter.
Buyers should ask the supplier for:
- Dispatch logic explanation
- Simulation based on site load data
- Metering interval assumptions
- Control response time
- Event logs
- Fail-safe behavior
- Manual override options
Step 10: Compare ROI Under Multiple Scenarios
Do not evaluate only the best-case ROI. Model at least three scenarios.
| Scenario | Assumption | Why it matters |
|---|---|---|
| Base case | Expected demand savings and normal operating cost | Main business case |
| Conservative case | Lower avoided demand, higher O&M, more degradation | Tests downside risk |
| Upside case | Higher demand charges, additional TOU savings, solar shifting | Shows extra value |
Sensitivity analysis should include:
- Demand charge rate
- Avoided kW
- Peak duration
- Battery cost
- O&M cost
- Efficiency
- Degradation
- Tariff changes
- Financing cost
- System availability
A robust project should still make sense under conservative assumptions.
Hidden ROI Risks Buyers Often Miss
One missed peak can erase savings
If the system misses one high peak during the month, the demand charge may be set before the battery can recover value. This is especially risky with demand ratchets.
The battery is sized for the wrong peak duration
If the battery can deliver 150 kW for one hour but the actual peak lasts three hours, the system may reduce only part of the peak.
Charging creates a new peak
If the EMS charges the battery while facility load is already high, the system may increase demand instead of reducing it.
Degradation reduces usable capacity
A system that works in year one may fall short in later years unless degradation is included in the model.
Demand charges change
Tariffs can change. Buyers should understand whether project value depends on one specific tariff structure.
O&M is underestimated
Cooling, monitoring, inspection, spare parts, and service response may affect net savings.
Supplier performance is not guaranteed
If the contract guarantees only equipment delivery but not usable capacity, dispatch performance, or system availability, the buyer may carry most of the ROI risk.
Peak Shaving ROI Checklist for B2B Buyers
Before approving a project, confirm:
- Demand charge rate and billing interval
- Monthly and seasonal peak demand
- Peak duration
- Target demand reduction
- Required battery kW
- Required usable battery kWh
- PCS power rating
- EMS response time
- Charging schedule
- Round-trip efficiency
- Battery degradation assumptions
- O&M cost
- Warranty and capacity retention
- System availability guarantee
- Tariff change sensitivity
- Full installed cost
- Exclusions in supplier quote
- Financing assumptions
Supplier Questions Before Procurement
Ask each supplier:
- Can you simulate peak shaving using our interval load data?
- What demand reduction can the system guarantee under real operating limits?
- Is the power rating measured on the AC side or DC side?
- What usable capacity is guaranteed at beginning and end of warranty?
- How does the EMS avoid creating new peaks during charging?
- What happens if the battery reaches low SOC during a peak event?
- How are derating events recorded?
- What O&M costs should be included?
- What certifications and safety documentation are available?
- Who is responsible if BMS, PCS, and EMS integration fails?
For broader supplier evaluation, see the Energy Storage System Suppliers Guide and the BMS vs PCS vs EMS guide.
Example ROI Model
Assume a commercial facility has:
- Existing monthly peak: 900 kW
- Target peak after storage: 720 kW
- Avoided demand: 180 kW
- Demand charge: $20/kW
- Peak season months: 10
- Total installed BESS cost: $240,000
- Annual O&M: $4,000
Monthly savings:
180 kW x $20/kW = $3,600
Annual gross savings:
$3,600 x 10 = $36,000
Annual net savings:
$36,000 - $4,000 = $32,000
Simple payback:
$240,000 / $32,000 = 7.5 years
Now test a conservative case:
- Avoided demand falls to 140 kW
- Annual O&M rises to $5,000
Monthly savings = 140 x $20 = $2,800
Annual gross savings = $2,800 x 10 = $28,000
Annual net savings = $28,000 - $5,000 = $23,000
Simple payback = $240,000 / $23,000 = 10.4 years
This comparison shows why buyers should not rely on a single optimistic estimate.
When Peak Shaving Battery Storage Makes Sense
Peak shaving is usually more attractive when:
- Demand charges are high
- Peak events are predictable
- Peak duration is not too long
- The facility has reliable interval load data
- The EMS can dispatch accurately
- The system can charge without creating new peaks
- The battery can support multiple value streams
- The supplier can prove usable capacity and control performance
It may be less attractive when:
- Demand charges are low
- Peaks are random and long
- Load data is unavailable
- Tariff rules are uncertain
- The battery is used only a few times per year
- Installation costs are high
- There is no clear O&M plan
How VoltCrave Power Supports Peak Shaving Projects
VoltCrave Power supports global energy storage buyers with LiFePO4 cells, battery packs, residential ESS, portable power stations, and commercial energy storage solutions.
For peak shaving projects, buyers need more than a battery cabinet. They need correct power and energy sizing, BMS protection, PCS matching, EMS dispatch, thermal design, documentation, and long-term supplier support.
VoltCrave Power can support:
- Commercial BESS product selection
- Battery capacity and power matching
- LiFePO4 battery solution supply
- OEM and ODM cooperation
- Project-specific technical communication
- Supplier documentation for global buyers
To evaluate a project, review the Peak Shaving Energy Storage guide or contact VoltCrave Power with your load profile and target application.
FAQs
What is peak shaving battery storage?
Peak shaving battery storage uses a battery energy storage system to discharge during high-demand periods and reduce the facility’s measured peak demand.
What data is needed to calculate peak shaving ROI?
Buyers need demand charge rates, interval load data, peak duration, target demand reduction, battery cost, O&M cost, efficiency, degradation assumptions, and tariff rules.
Can peak shaving ROI be calculated from one electricity bill?
A bill can provide a first estimate, but it is not enough for accurate ROI. Interval load data is needed to understand peak timing and duration.
What is the biggest risk in peak shaving ROI?
The biggest risk is assuming the battery will reduce every peak perfectly. One missed peak, poor EMS dispatch, or incorrect sizing can reduce expected savings significantly.
Does battery degradation affect ROI?
Yes. As usable battery capacity declines, the system may not sustain the same peak reduction unless the original design includes margin or an augmentation plan.
Can peak shaving be combined with solar storage?
Yes. Many commercial systems combine peak shaving with solar self-consumption or time-of-use shifting. The EMS must coordinate SOC reserve and dispatch priorities.
Final Takeaway
Peak shaving battery storage ROI is not determined by battery price alone. It depends on demand charges, avoided kW, peak duration, usable capacity, PCS power, EMS accuracy, efficiency, degradation, O&M cost, and tariff stability.
The best ROI calculation starts with real load data, uses conservative assumptions, and evaluates whether the BESS can reduce the actual billing peak under real operating conditions.
For B2B buyers, the most important question is not:
How cheap is the battery?
It is:
Can this complete BESS reliably reduce my demand charges over the warranty life of the project?
References
- Battery Energy Storage System Evaluation Method – U.S. Department of Energy
- On-Site Energy Storage Decision Guide – U.S. Department of Energy Better Buildings
- Energy Storage Valuation: A Review of Use Cases and Modeling Tools – U.S. Department of Energy
Need help matching this topic to a real battery project?
Send your target application, capacity range, certification market, and order plan. VoltCrave can recommend a practical product direction.