
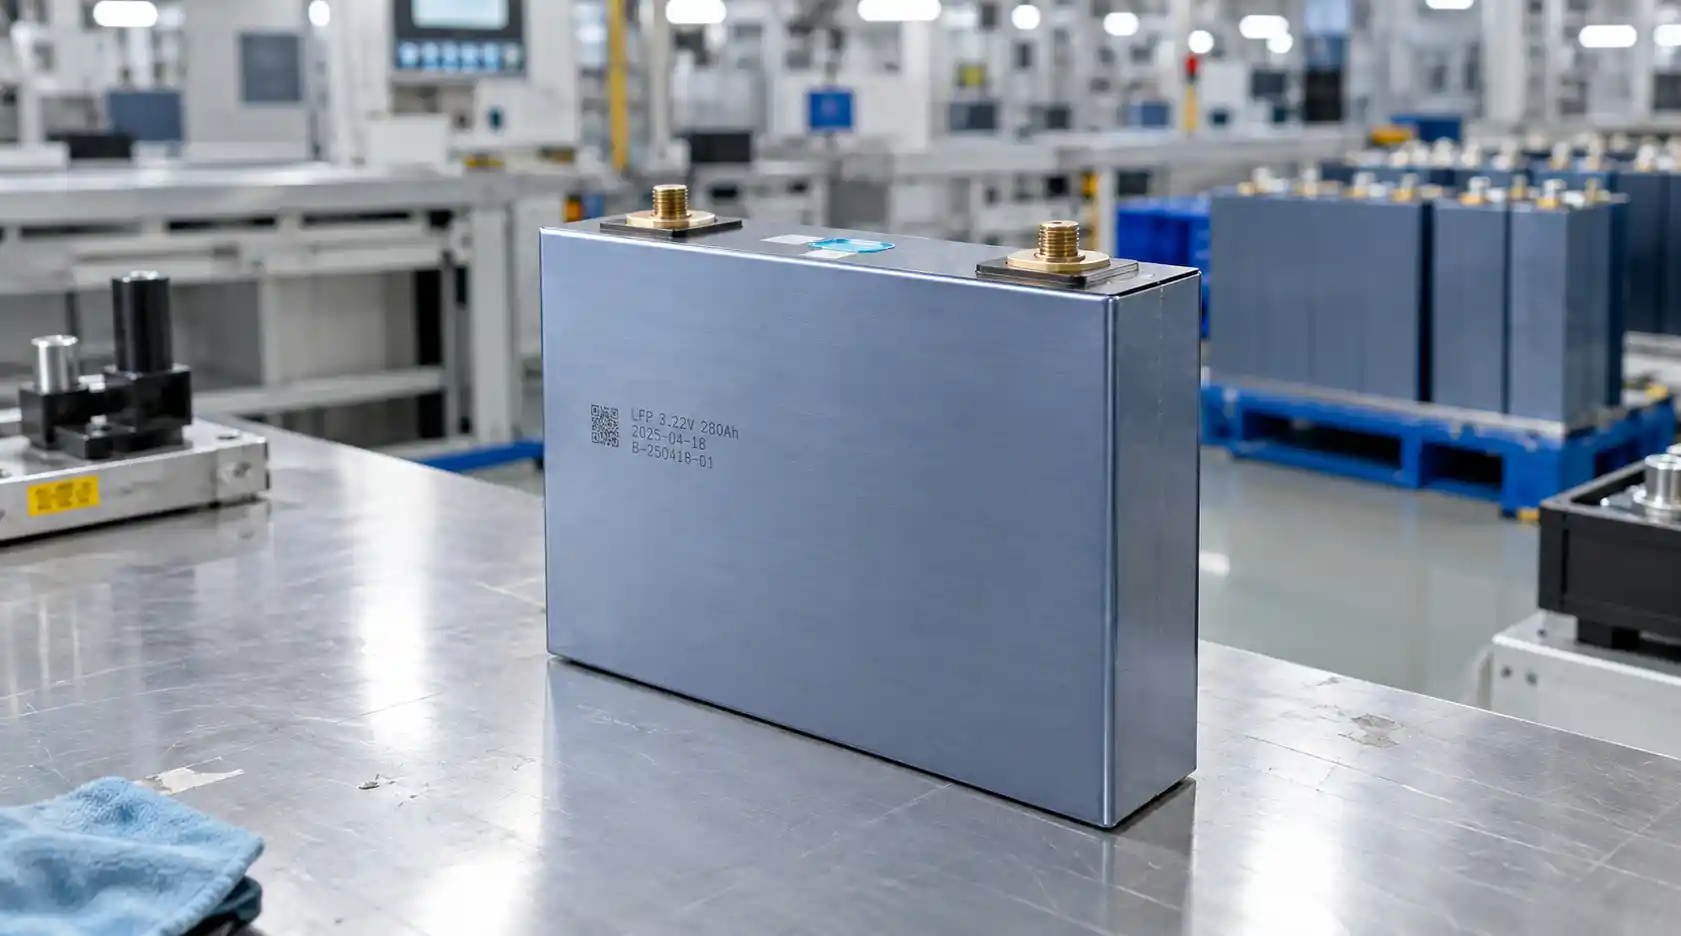
You just installed a new LiFePO4 battery, opened the monitoring app, and noticed something strange: between 80 % and 30 % state of charge, the voltage barely moves. It reads 3.22 V almost the entire time. Is the battery broken?
No. The 3.22 V you see is the chemical fingerprint of the cell. It is the same number you will find on a 280 Ah prismatic datasheet, on a 51.2 V residential rack, on a 192 V industrial UPS, and on a 3.44 MWh container BESS. Understanding what 3.22 V means, and what it does not mean, is the starting point for any LFP system design.
The two-phase chemistry behind 3.22 V
The 3.22 V figure is not a manufacturer’s rounding choice. It is locked in by the way LiFePO₄ reacts with lithium ions at the atomic level.
Inside a discharging LiFePO₄ cathode, two crystal phases coexist:
- LiFePO₄ is the lithium-rich phase.
- FePO₄ is the lithium-poor phase.
As lithium ions leave the cathode, the phase boundary moves, but both phases continue to coexist across a wide composition range. Whenever two phases are in equilibrium, the electrochemical potential between them stays nearly constant. That constant potential is the stable voltage you read at the terminal.
For a broader comparison with NMC and other lithium chemistries, see LFP vs NMC chemistry.
Why the voltage stays locked at ~3.2 V
The LiFePO₄ / FePO₄ equilibrium potential is set by thermodynamics, so the cell voltage hovers in a narrow band across most of the discharge cycle. Industry-standard tests report this plateau at:
- 3.30-3.35 V per cell at 100 % SOC (resting, after surface charge decays)
- 3.20-3.22 V per cell across the 20-80 % SOC window
- 2.80-3.00 V per cell near the discharge cutoff
The middle band (3.20-3.22 V) is what a monitoring app shows you most of the day. It is the chemistry, not a fault.
Why the number is “3.22 V” and not “3.2 V” or “3.3 V”
Different sources label the same cell slightly differently:
- 3.2 V is the theoretical nominal voltage used in textbooks.
- 3.22 V is the typical operating voltage measured at 0.5 C and 25 °C, which is the standard reference condition on most cell datasheets.
- 3.3 V is the resting open-circuit voltage near 50 % SOC after surface charge has decayed.
The “3.22 V” on a spec sheet is the engineering choice for a specific reference condition.
Decoding every voltage on the LFP spec sheet
A typical LiFePO4 datasheet lists four voltage values. Each one tells you something different about the cell’s state.
| Voltage | Value per cell | When you see it |
|---|---|---|
| Charging cutoff (max) | 3.65 V | At the end of a CC-CV charge cycle |
| Resting full charge | 3.30-3.40 V | 30 min after charge stops |
| Typical operating | 3.20-3.22 V | During normal discharge |
| Discharge cutoff (min) | 2.50 V | BMS undervoltage protection |
These four values are not interchangeable. A cell at “3.2 V” on a multimeter could be at 30 % SOC or at 80 % SOC. The resting voltage only narrows the range after the surface charge has decayed, which takes at least 30 minutes.
SOC vs resting voltage vs charging voltage
| SOC | Charging (top of charge) | Resting OCV (after 30 min) | Notes |
|---|---|---|---|
| 100 % | 3.60-3.65 V | 3.30-3.40 V | Full charge |
| 90 % | ~3.35 V | ~3.30 V | Plateau begins |
| 80 % | ~3.32 V | ~3.27 V | Mid-plateau |
| 50 % | ~3.28 V | ~3.27 V | Mid-plateau |
| 20 % | ~3.25 V | ~3.20 V | End of plateau |
| 10 % | ~3.20 V | ~3.10 V | Knee starts |
| 0 % | ~3.00 V | ~2.90 V | Cutoff approaching |
The flatness of the middle band is the design constraint that defines every LFP system in production.
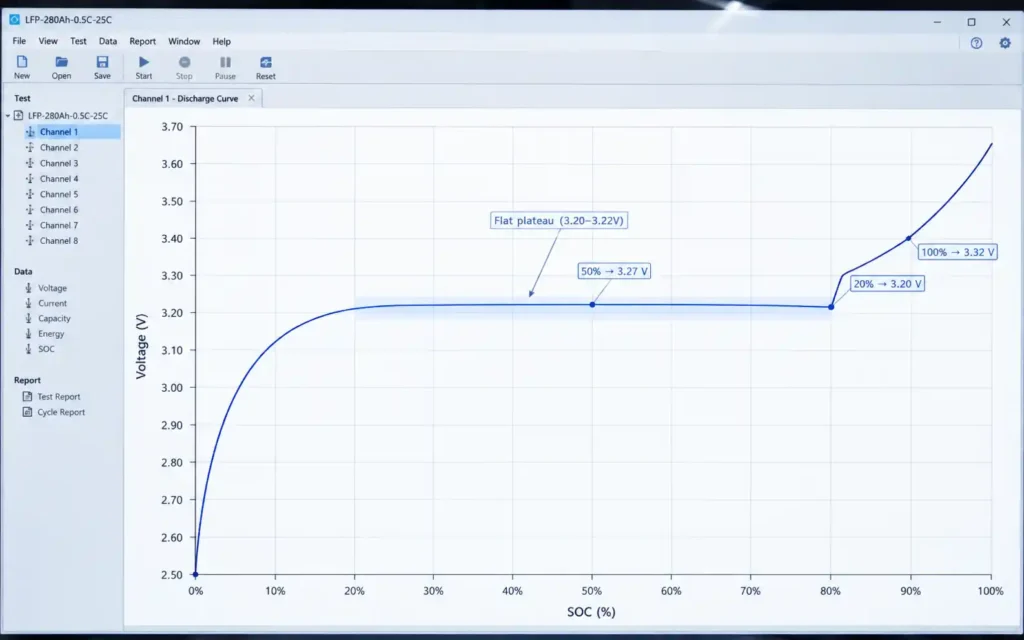
The “flat plateau”: why LFP voltage barely moves
The LFP discharge curve has three distinct zones, and the middle one is the flattest of any mainstream lithium chemistry.
Top zone (80 %-100 %): the quick drop after charging
Right after a CC-CV charge finishes, the cell voltage reads 3.60-3.65 V. Surface charge sits on the electrode interface. After 30 minutes of rest, the voltage settles to 3.30-3.40 V. This drop is normal and is not a sign of self-discharge.
Flat zone (20 %-80 %): where the voltage holds
Across this 60 % of usable capacity, the cell voltage changes by only about 100 mV. A monitoring app appears stuck near 3.22 V.
The stability is useful for voltage-sensitive electronics and for inverter output regulation. It also means voltage alone cannot reliably estimate SOC across this band.
Bottom zone (0 %-20 %): the steep drop before cutoff
Below about 10 % SOC, the curve steepens and the voltage drops quickly toward the 2.5 V cutoff. A pack that appears healthy can drop from 3.20 V to 2.50 V in a relatively short window.
The cutoff never arrives evenly. The weakest cell reaches 2.5 V first, and the BMS disconnects the entire pack to protect it.
From 3.22 V to 12 V / 24 V / 48 V / 192 V: the math of ESS
Every ESS voltage in the field is a multiple of a single 3.2 V cell. The most common configurations are:
| Pack voltage | Series count (S) | Typical application |
|---|---|---|
| 12.8 V | 4S | Small off-grid, RV, low-voltage DC |
| 25.6 V | 8S | 24 V marine / RV systems |
| 51.2 V | 16S | 48 V residential and C&I standard |
| 192 V | 60S | Telecom DC, three-phase hybrid inverters |
| 384 V | 120S | Industrial UPS, data centers |
| 700-1500 V DC | 220-470S | Container BESS, utility scale |
The 51.2 V (16S) configuration is the most common in residential and commercial storage. It defines the commercial and industrial ESS voltage class, pairs naturally with 48 V inverters, charges efficiently from typical PV arrays, and keeps the series count low enough for cell balancing to remain tractable.
Why 16S, not 15S or 17S
A nominal 48 V lead-acid bank is 24 cells × 2 V = 48 V, with an operating band of roughly 41-58 V depending on chemistry. Lithium designers standardized on 16S × 3.2 V = 51.2 V because the voltage window matches the 48 V inverter input with adequate headroom, the 16-cell count is manageable for high-quality BMS balancing, and the architecture maps cleanly onto a 4S-per-module × 4-modules cabinet layout.
5 prismatic LFP cells currently rated at 3.22 V: a spec comparison
The 3.22 V nominal does not differentiate cells within a chemistry. Capacity and C-rate do.
| Model | Capacity | Nominal voltage | C-rate | Typical use |
|---|---|---|---|---|
| A24 | 172.1 Ah | 3.22 V | 1C | Standard C&I ESS |
| A25 | 132.2 Ah | 3.22 V | 3C | High-power commercial storage |
| A28 | 87 Ah | 3.22 V | 3C | Modular rack systems |
| A41-V2 | 116 Ah | 3.22 V | 1C | Commercial / residential |
| A41-V3 | 122 Ah | 3.22 V | 3C | High-power commercial storage |
Reading the table:
- All five cells share the same nominal voltage. Voltage does not distinguish them.
- A higher C-rate cell trades capacity for power. The A25 (132.2 Ah at 3C) delivers less energy than the A24 (172.1 Ah at 1C), but it can sustain three times the discharge current without significant voltage sag.
- The same nominal voltage allows interchangeability at the string level. A 3C cell in a 1C pack is wasted spend, and a 1C cell in a 3C pack will sag or trip the BMS prematurely.
A production module built on this 16S architecture is the 51.2 V 200 Ah LiFePO4 PowerWall, with cabinet-level paralleling scaling the total capacity from 10 kWh to 24 kWh.
When evaluating a cell datasheet, treat the 3.22 V nominal as a given and focus on capacity (Ah), C-rate, internal resistance (mΩ), and cycle life at the operating depth-of-discharge you intend to run.
The three zones: why your battery cuts off early
A healthy pack and a degraded pack can both read “3.22 V” on the monitoring app. What separates them is what happens at the cutoff.
Cell imbalance and the weakest-cell cutoff
A pack is only as strong as its weakest cell. As cells age at slightly different rates, their SOC curves drift apart. The pack’s displayed voltage is the average, but the BMS measures every cell individually.
When the weakest cell hits 2.5 V, the BMS disconnects the entire pack, even if the average cell still has 15 % capacity remaining. To the user, the battery appears to die suddenly at 30 % SOC.
For the underlying mechanics of how SOC, SOH, and capacity track over time, see SOC vs SOH.
Why healthy packs and degraded packs cut off differently
A balanced pack reaches 2.5 V on every cell at roughly the same time. An imbalanced pack reaches 2.5 V on the weakest cell long before the others. The faster the cells drift, the more usable capacity the pack loses before the BMS trips.
This is the dominant cause of “my battery used to run for 8 hours and now it runs for 5.” The cause is string drift, not a single cell failure.
Diagnosing imbalance before it triggers a cutoff
Three signals indicate the early stages of imbalance:
- A voltage spread greater than 30 mV between the highest and lowest cell at rest, read through the BMS app.
- A cell whose internal resistance has risen more than 30 % over 1,000 cycles, relative to its neighbors.
- Drift in the full-cycle SOC curve toward earlier cutoff compared to the datasheet reference.
Voltage hysteresis, internal resistance, and cold weather
The 3.22 V figure is a resting, room-temperature reference. Real operating conditions shift it.
Hysteresis: why charging voltage differs from discharging voltage
In a LiFePO4 cell, the equilibrium potential on charge differs from the equilibrium potential on discharge. At the same SOC:
- The charging voltage is typically 50-150 mV higher than the discharging voltage.
- The effect comes from lattice strain, phase-transformation dynamics, concentration gradients, and SEI resistance inside the cathode.
A BMS that ignores hysteresis will report a higher SOC during charge and a lower SOC during discharge at the same true state of charge, which is the source of the “jumping SOC” users complain about.
Internal resistance and voltage sag under load
Under load, the terminal voltage drops by I × R_internal. For a cell with 20 mΩ internal resistance under 50 A load, the drop is 1.0 V.
If a 12 V (4S) pack reads 13.2 V at rest but 12.2 V under a 50 A load, the cell is not damaged. The voltage sag is a predictable consequence of internal resistance and the reason spec sheets list both a continuous and a peak discharge current.
Cold weather voltage drop (0 °C vs 25 °C vs 45 °C)
At low temperatures, the electrolyte conductivity drops and the charge-transfer resistance rises:
- Voltage reads 0.2-0.3 V lower at 0 °C than at 25 °C at the same SOC.
- Usable capacity drops 20-30 % at -10 °C for unprotected cells.
- Lithium plating becomes a real risk if charging is attempted below 0 °C.
For detailed guidance on cold-weather operation, see cold-weather LFP charging.
Why the BMS uses Coulomb counting, not voltage
Given the flatness of the LFP plateau, voltage alone is a poor SOC indicator in the 20-80 % band. Modern BMS designs handle this with a hybrid algorithm.
Voltage-based SOC works only at the ends
Voltage-based SOC works well at the steep ends of the curve, below 10 % and above 90 %. In the middle band, a 30 mV swing can represent a 20 % change in SOC. That resolution is unusable for a state-of-charge display.
For this reason, voltage is treated as a coarse reference and as a calibration trigger at the endpoints, not as the primary SOC input.
Coulomb counting across the plateau
Coulomb counting integrates current in and current out over time. Starting from a known SOC reference (typically a full charge), the BMS tracks:
- Amp-hours removed during discharge.
- Amp-hours returned during charge, adjusted for charge efficiency.
Coulomb counting is accurate across the flat plateau where voltage provides no information. It does drift over time, so the BMS recalibrates against the voltage endpoints at every full charge cycle.
Reliable BMS implementations enforce voltage thresholds, current limits, temperature windows, and cell-imbalance protections across the operating envelope.
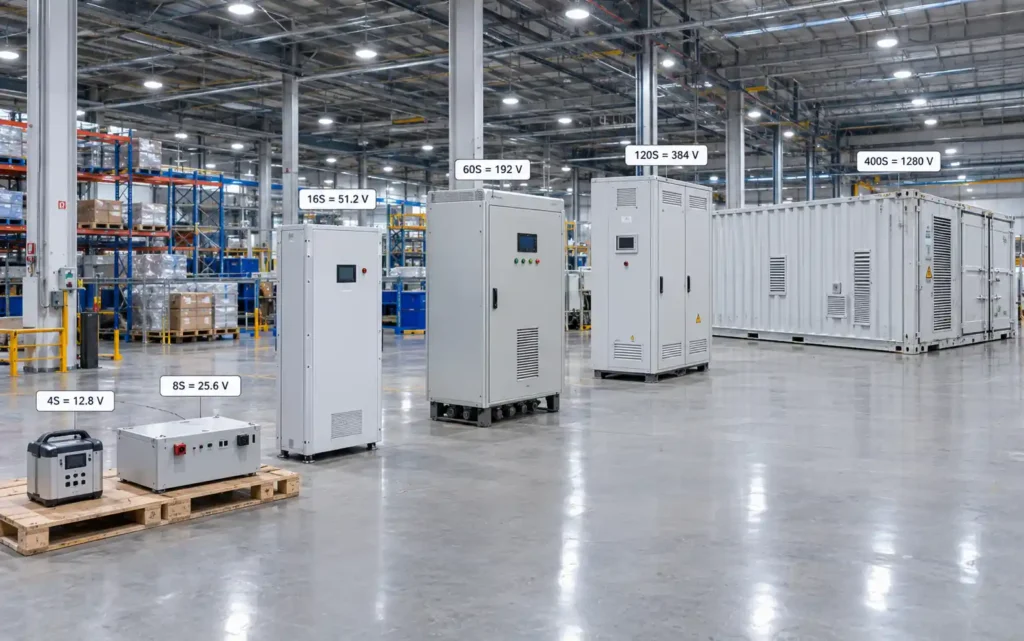
4 real-world configurations built on 3.22 V cells
A 3.22 V cell only becomes useful when it is assembled into a working system. Four reference configurations, all from the same chemistry:
Residential: 13.2 kW / 15 kWh (4S × 4P architecture)
Sixteen cells arranged as 4 in series × 4 in parallel yields a 12.8 V / 600 Ah pack, a 15 kWh residential system. The 4S count keeps inverter compatibility with 12 V-class hybrid chargers, and the 4P configuration delivers 600 Ah capacity at 0.5 C continuous discharge.
Small C&I: 5 kW / 5.12 kWh (16S configuration)
A single 16S string of 100 Ah cells gives 51.2 V × 100 Ah = 5.12 kWh. This is the smallest standard 48 V residential C&I block, suitable for one cabinet serving a small shop or a backup panel.
C&I ESS: 150 kW / 450 kWh (16S modular cabinets)
A modular commercial installation strings hundreds of 16S × 100 Ah modules in parallel at the cabinet level. 450 kWh at 51.2 V is 8,789 Ah total capacity across parallel strings, enough to peak-shave a commercial load profile or back up a manufacturing line.
Container BESS: 3.44-5.16 MWh (liquid-cooled, 1C)
Container-scale systems operate at 700-1500 V DC to keep current manageable. A 3.44 MWh container at 1280 V DC requires 400S × 280 Ah cells in series (112,000 cells) coordinated by a hierarchical BMS with cell, module, rack, and container-level monitoring. Liquid cooling holds the temperature differential across the container under 3 °C, which is necessary for the cells to deliver consistent 1C charge and discharge.
How to choose the right 3.2 V configuration
Application to pack voltage
| Application | Recommended pack voltage | Reason |
|---|---|---|
| Off-grid cabin, small RV | 12.8 V (4S) | Compatibility with 12 V DC loads |
| Marine, mid-size RV | 25.6 V (8S) | Higher power, lower current |
| Residential solar + storage | 51.2 V (16S) | Standard inverter compatibility |
| Three-phase hybrid inverter | 192 V (60S) or higher | Matches DC bus voltage |
| Industrial UPS | 192-384 V | DC bus architecture |
| Utility / container BESS | 700-1500 V DC | Low current at MW scale |
Sizing worksheet: capacity, voltage, C-rate
For any given load profile, three numbers lock in the cell choice:
- Pack voltage equals the inverter input voltage window.
- Pack capacity (kWh) equals backup runtime multiplied by average load.
- Pack C-rate equals peak power divided by (pack voltage × pack capacity).
A 10 kWh / 5 kW residential pack needs only 0.5 C continuous. A 100 kWh / 100 kW commercial peak-shaving system needs 1C continuous. A grid-forming inverter at 1 MW peak needs 2-4 C cells or active liquid cooling.
Prismatic cells vs. rack-mounted modules
Prismatic cells make sense when the pack assembly is custom (an OEM partner builds modules from cells, or the form factor is unusual, such as a battery box for an e-bike or a low-profile wall mount).
Rack-mounted modules make sense when the project is 5 kWh or larger, uses 48 V architecture, prioritizes fast installation over custom form factor, or requires module-level serviceability.
FAQs
What is the nominal voltage of a LiFePO4 cell?
3.2 V theoretical / 3.22 V typical at 0.5 C and 25 °C.
Why is LiFePO4 voltage flat during discharge?
A two-phase LiFePO4 / FePO4 reaction gives a constant equilibrium potential across most of the SOC range.
What is the voltage range of LiFePO4?
2.5 V (discharge cutoff) to 3.65 V (full charge), with the plateau sitting at ~3.2-3.3 V.
How many cells for a 48 V LiFePO4 battery?
16 cells in series. 16S × 3.2 V = 51.2 V.
What voltage is 50 % SOC for LiFePO4?
~3.27 V at rest, though the flat plateau makes voltage-only SOC estimation unreliable in the 20-80 % band.
Is 3.2 V the same as 3.22 V?
No. 3.2 V is the textbook nominal voltage; 3.22 V is the typical operating voltage measured at 0.5 C and 25 °C.
What is the charging voltage for LiFePO4?
3.65 V per cell, which translates to 14.6 V for a 12 V pack and 58.4 V for a 48 V pack.
Why does my LiFePO4 battery voltage drop quickly under load?
Internal resistance causes voltage sag. A 50 A load on a cell with 20 mΩ IR drops the terminal voltage by ~1 V.
Conclusion
3.22 V is the chemical fingerprint of LiFePO4 — the foundation of every voltage configuration from a single cell to a multi-megawatt container. What varies with the application is not the chemistry but the architecture: capacity, C-rate, internal resistance, and cycle life at the operating depth-of-discharge.
The same 3.22 V prismatic cell underpins everything from a 12 V portable power station to a 5.16 MWh utility-scale container. VoltCrave Power ships 51.2 V rack modules, 192 V industrial blocks, and 1C liquid-cooled container BESS built on this single chemistry.
Need help matching this topic to a real battery project?
Send your target application, capacity range, certification market, and order plan. VoltCrave can recommend a practical product direction.